Late last year, we got our first full look at Census 2021 data, courtesy of the Australian Bureau of Statistics, so The Greater Springfield Times is breaking down some of the findings by suburb.
Springfield’s population is generally younger than the national average, with reasonably higher median income levels, particularly in Augustine Heights and Brookwater.
Home ownership, however, is substantially lower across the board, especially in the Springfield to Spring Mountain corridor.
For these statistics, Camira residents are closer to the national averages. And apart from Camira, Springfield residents moved in much more recently.
Motor vehicle travel for work is very high – this is somewhat expected in outer suburbs. Working from home is less common than nationally.
Reported health issues are a mixed bag, but notably Camira has the highest rates in the area, while Augustine Heights and Brookwater appear much healthier, and is the only area where mental health isn’t the top health issue.
As Census 2021 was conducted during the peak of the pandemic, workers whose employment was terminated because of the pandemic were counted as employed for the purposes of the census.
Jump to:
- Springfield
- Springfield Lakes, Springfield Central, and Spring Mountain (combined)
- Augustine Heights and Brookwater (combined)
- Camira
- Bellbird Park
AUSTRALIA
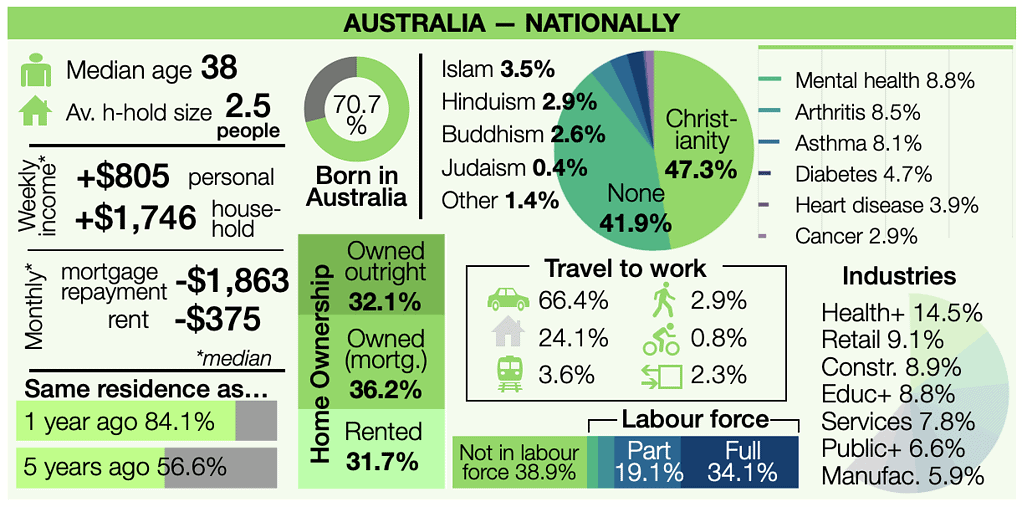
Median age: 38
Average household size: 2.5 people
Median weekly personal income: $805
Median weekly household income: $1,746
(Median = half of the total is above/higher, and half is below/lower)
Home ownership:
Owned (outright) – 32.1%
Owned (mortgage) – 36.2%
Rented – 31.7%
Median monthly mortgage repayment – $1,863
Median weekly rent – $375
These figures are based on estimates that residents of this suburb entered in the census so are not based on tax data or real estate listings. This data excludes rare household arrangements, such as people who are living rent-free.
Industry of residents:
Health Care and Social Assistance – 14.5%
Retail Trade – 9.1%
Construction – 8.9%
Education and Training – 8.8%
Professional, Scientific, Technical Services – 7.8%
Public Administration and Safety – 6.6%
Manufacturing – 5.9%
Percentages are based on the number of employed people aged 15 or over who specified their industry of employment in the census. The figures do not include people who are currently unemployed. The industry grouping ‘Other Services’ has been excluded from the data. The top five industries of employment are for the people who live in this suburb, not for jobs located in the suburb.
Labour force (all people 15+ who work OR are looking to work):
In labour force – 61.1%
Employed – 94.9%
Unemployed – 5.1%
Not in labour force – 38.9%
The labour force is defined by the ABS as people aged 15 or over who are employed or who are unemployed and looking for work. People who are not in the labour force include those aged 15 or over who are not looking for paid work, retirees and people who are unable to work. ‘Away from work’ includes employed people aged 15 and over on holiday, sick or personal leave, people who worked zero hours in the week of the census, people who had been temporarily stood down as a result of COVID-19 lockdowns, and people who did not specify their working hours.
Employment type (of all people in labour force):
Full-time employed – 55.9%
Part-time employed – 31.2%
Away from work – 7.8%
Unemployment rates per age group (of all people in each age group):
Ages 15-24 – 10.8%
Ages 25-34 – 4.8%
Ages 35-44 – 3.7%
Ages 45-54 – 3.7%
Ages 55-64 – 4.3%
Percentages are based on people in each age group who are unemployed and looking for work. People who are not looking for work are not classed as being in the labour force, so are not classed as being unemployed. People who were temporarily stood down from work as a result of COVID-19 lockdowns were not classed as unemployed.
1-year residency movement:
Same address as 1 year ago – 84.1%
Different address from 1 year ago – 15.9%
5-year residency movement:
Same address as 5 years ago – 56.6%
Different address from 5 years ago – 43.4%
Percentages are based on the current residents of the selected suburb and current residents of Australia. The data does not show whether people have moved away from a selected suburb.The data is based on place of usual residence so does not include people who were on holiday one or five years ago. Responses where this question was skipped have been excluded.
Travel to work:
Motor vehicle – 66.4%
Working from home – 24.1%
Public transport – 3.6%
Walking – 2.9%
Cycle – 0.8%
Multiple modes of transport – 2.3%
These percentages exclude people who did not go to work on census day or who used other or unspecified modes of transport to travel to work. Motor vehicles include cars, taxis/rideshares, trucks, motorbikes and motor scooters. Public transport includes trains, buses, trams/light rail and ferries. Walked includes people who walked to their workplace without using any other form of transport. Multiple forms of transport include two or more combinations of the modes of transport listed here (for example, could include someone who cycled to a train station, caught a train, and then walked five kilometres from the station to their place of work). Percentages have been rounded and may not add up to 100.
Religion:
Christianity – 47.3%
No religion – 41.9%
Islam – 3.5%
Hinduism – 2.9%
Buddhism – 2.6%
Judaism – 0.4%
Other – 1.4%
Country of birth:
Born in Australia – 70.7%
Born overseas – 29.3%
Percentages are based on the number of people who specified their religion or country of birth on the census. Responses where this question was skipped have been excluded.
Health issues (6 months or more):
Mental health condition – 8.8%
Arthritis – 8.5%
Asthma – 8.1%
Diabetes – 4.7%
Heart disease – 3.9%
Cancer (including remission) – 2.9%
Respondents to this question were asked to tick the box of any long-term health issue that they had been told that they have by a doctor or nurse, and which was expected to last for six months or more. Percentages are based on the number of people who answered this question on the census. Responses where this question was skipped have been excluded.
Jump to top.
SPRINGFIELD
- Springfield data specifically refers to only the suburb of Springfield (north of Centenary Highway).
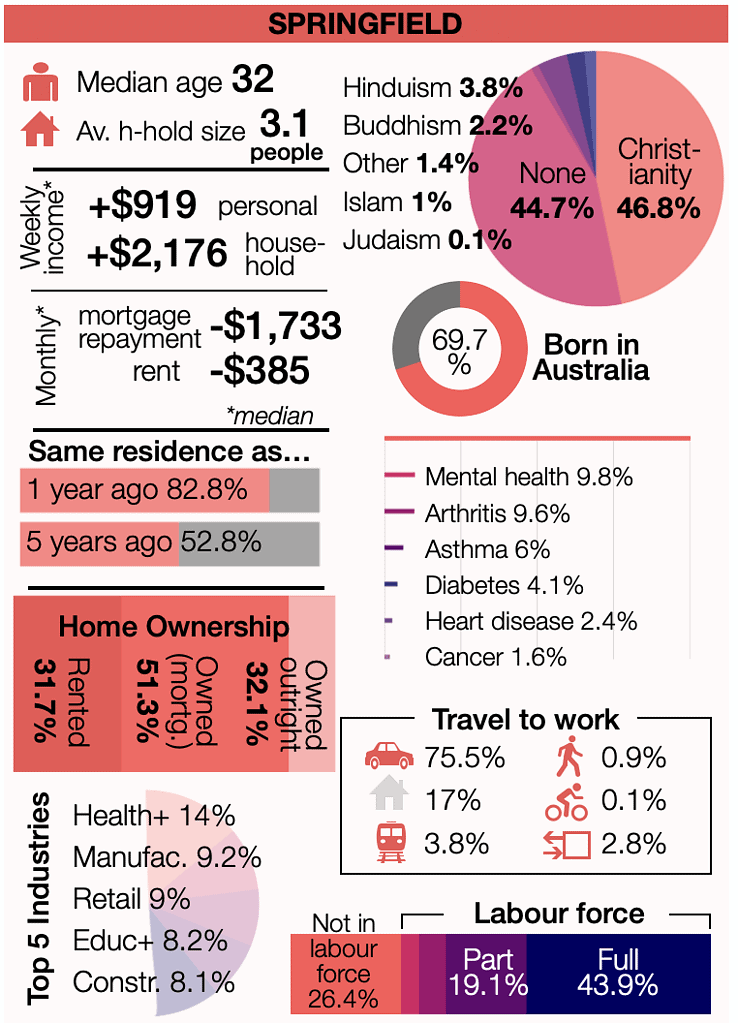
Median age: 32 (National: 38)
Average household size: 3.1 people (National: 2.5 people)
Median weekly personal income: $919 (National: $805)
Median weekly household income: $2,176 (National: $1,746)
Home ownership:
Owned (outright) – 14.9% (National: 32.1%)
Owned (mortgage) – 51.3% (National: 36.2%)
Rented – 33.8% (National: 31.7%)
Median monthly mortgage repayment – $1,733 (National: $1,863)
Median weekly rent – $385 (National: $375)
Top 5 industries of residents:
Health Care and Social Assistance – 14% (National: 14.5%)
Manufacturing – 9.2% (National: 5.9%)
Retail Trade – 9% (National: 9.1%)
Education and Training – 8.2% (National: 8.8%)
Construction – 8.1% (National: 8.9%)
Labour force (all people 15+ who work OR are looking to work):
In labour force – 73.6% (National: 61.1%)
Employed – 94.3% (National: 94.9%)
Unemployed – 5.7% (National: 5.1%)
Not in labour force – 26.4% (National: 38.9%)
Employment type (of all people in labour force):
Full-time employed – 59.7% (National: 55.9%)
Part-time employed – 26% (National: 31.2%)
Away from work – 8.7% (National: 7.8%)
Unemployment rates per age group (of all people in each age group):
Ages 15-24 – 13.9% (National: 10.8%)
Ages 25-34 – 4.5% (National: 4.8%)
Ages 35-44 – 3.9% (National: 3.7%)
Ages 45-54 – 2.8% (National: 3.7%)
Ages 55-64 – 3.8% (National: 4.3%)
1-year residency movement:
Same address as 1 year ago – 82.8% (National: 84.1%)
Different address from 1 year ago – 17.2% (National: 15.9%)
5-year residency movement:
Same address as 5 years ago – 52.8% (National: 56.6%)
Different address from 5 years ago – 47.2% (National: 43.4%)
Travel to work:
Motor vehicle – 75.5% (National: 66.4%)
Working from home – 17% (National: 24.1%)
Public transport – 3.8% (National: 3.6%)
Walking – 0.9% (National: 2.9%)
Cycle – 0.1% (National: 0.8%)
Multiple modes of transport – 2.8% (National: 2.3%)
Religion:
Christianity – 46.8% (National: 47.3%)
No religion – 44.7% (National: 41.9%)
Hinduism – 3.8% (National: 2.9%)
Buddhism – 2.2% (National: 2.6%)
Other – 1.4% (National: 1.4%)
Islam – 1% (National: 3.5%)
Judaism – 0.1% (National: 0.4%)
Country of birth:
Born in Australia – 69.7% (National: 70.7%)
Born overseas – 30.3% (National: 29.3%)
Health issues (6 months or more):
Mental health condition – 9.8% (National: 8.8%)
Arthritis – 9.6% (National: 8.5%)
Asthma – 6% (National: 8.1%)
Diabetes – 4.1% (National: 4.7%)
Heart disease – 2.4% (National: 3.9%)
Cancer (including remission) – 1.6% (National: 2.9%)
Jump to top.
SPRINGFIELD LAKES, SPRINGFIELD CENTRAL & SPRING MOUNTAIN
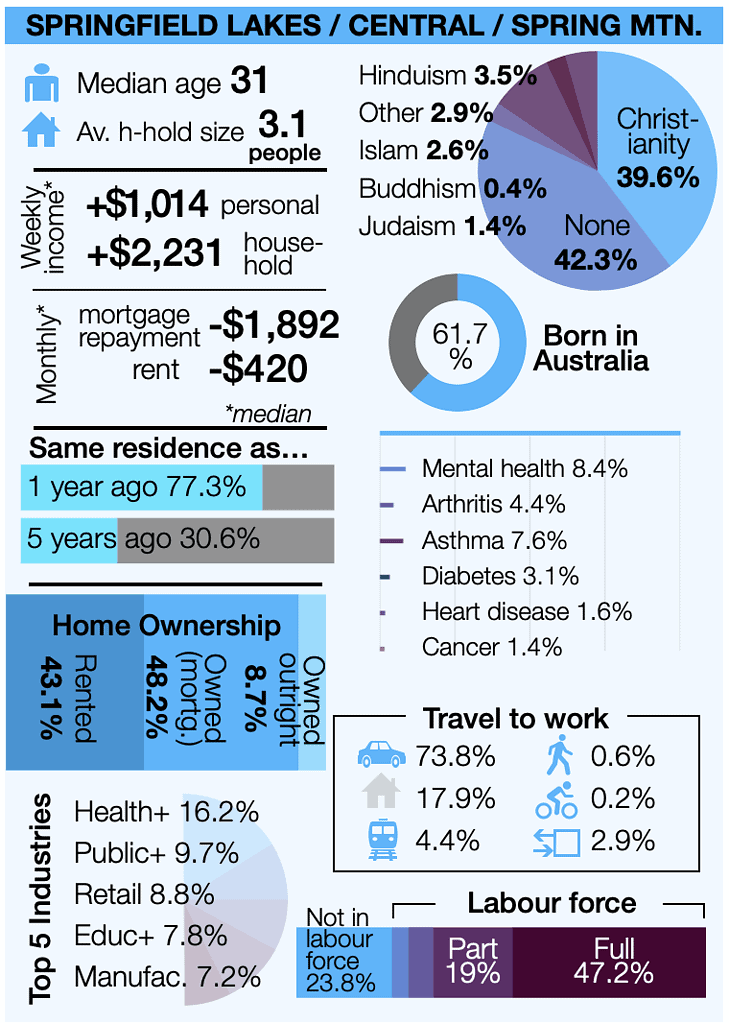
- Data for Springfield Lakes, Springfield Central, and Spring Mountain have been grouped together.
Median age: 31 (National: 38)
Average household size: 3.1 people (National: 2.5 people)
Median weekly personal income: $1,014 (National: $805)
Median weekly household income: $2,231 (National: $1,746)
Home ownership:
Owned (outright) – 8.7% (National: 32.1%)
Owned (mortgage) – 48.2% (National: 36.2%)
Rented – 43.1% (National: 31.7%)
Median monthly mortgage repayment – $1,892 (National: $1,863)
Median weekly rent – $420 (National: $375)
Top 5 industries of residents:
Health Care and Social Assistance – 16.2% (National: 14.5%)
Public Administration and Safety – 9.7% (National: 6.6%)
Retail Trade – 8.8% (National: 9.1%)
Education and Training – 7.8% (National: 8.8%)
Manufacturing – 7.2% (National: 5.9%)
Labour force (all people 15+ who work OR are looking to work):
In labour force – 76.2% (National: 61.1%)
Employed – 94.8% (National: 94.9%)
Unemployed – 5.2% (National: 5.1%)
Not in labour force – 23.8% (National: 38.9%)
Employment type (of all people in labour force):
Full-time employed – 61.9% (National: 55.9%)
Part-time employed – 25% (National: 31.2%)
Away from work – 7.9% (National: 7.8%)
Unemployment rates per age group (of all people in each age group):
Ages 15-24 – 15.2% (National: 10.8%)
Ages 25-34 – 4.1% (National: 4.8%)
Ages 35-44 – 3% (National: 3.7%)
Ages 45-54 – 2.9% (National: 3.7%)
Ages 55-64 – 3.7% (National: 4.3%)
1-year residency movement:
Same address as 1 year ago – 77.3% (National: 84.1%)
Different address from 1 year ago – 22.7% (National: 15.9%)
5-year residency movement:
Same address as 5 years ago – 30.6% (National: 56.6%)
Different address from 5 years ago – 69.4% (National: 43.4%)
Travel to work:
Motor vehicle – 73.8% (National: 66.4%)
Working from home – 17.9% (National: 24.1%)
Public transport – 4.4% (National: 3.6%)
Walking – 0.6% (National: 2.9%)
Cycle – 0.2% (National: 0.8%)
Multiple modes of transport – 2.9% (National: 2.3%)
Religion:
No religion – 42.3% (National: 41.9%)
Christianity – 39.6% (National: 47.3%)
Hinduism – 8.5% (National: 2.9%)
Other – 4.3% (National: 1.4%)
Islam – 2.6% (National: 3.5%)
Buddhism – 2.6% (National: 2.6%)
Judaism – 0.1% (National: 0.4%)
Country of birth:
Born in Australia – 61.7% (National: 70.7%)
Born overseas – 38.3% (National: 29.3%)
Health issues (6 months or more): INTEREST all lower than national
Mental health condition – 8.4% (National: 8.8%)
Asthma – 7.6% (National: 8.1%)
Arthritis – 4.4% (National: 8.5%)
Diabetes – 3.1% (National: 4.7%)
Heart disease – 1.6% (National: 3.9%)
Cancer (including remission) – 1.4% (National: 2.9%)
Jump to top.
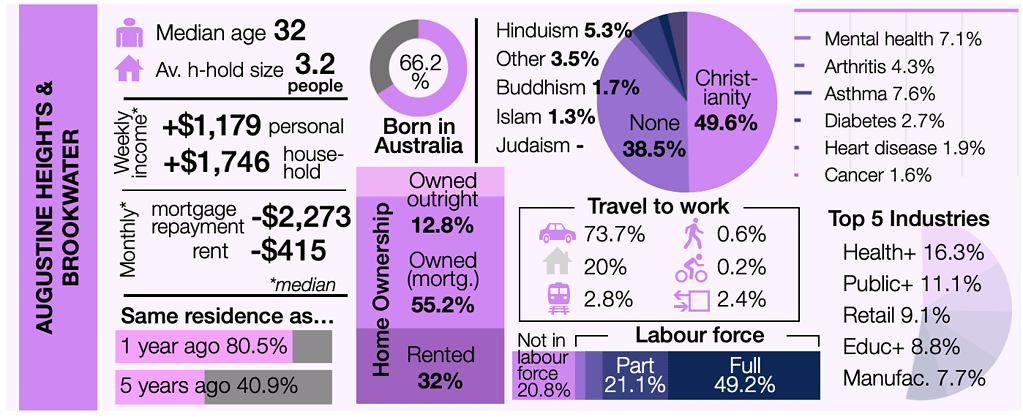
AUGUSTINE HEIGHTS & BROOKWATER
- Data for Augustine Heights and Brookwater have been grouped together.
Median age: 32 (National: 38)
Average household size: 3.2 people (National: 2.5 people)
Median weekly personal income: $1,179 (National: $805)
Median weekly household income: $2,825 (National: $1,746)
Home ownership:
Owned (outright) – 12.8% (National: 32.1%)
Owned (mortgage) – 55.2% (National: 36.2%)
Rented – 32% (National: 31.7%)
Median monthly mortgage repayment – $2,273 (National: $1,863)
Median weekly rent – $415 (National: $375)
Top 5 industries of residents:
Health Care and Social Assistance – 16.3% (National: 14.5%)
Public Administration and Safety – 11.1% (National: 6.6%)
Retail Trade – 9.1% (National: 9.1%)
Education and Training – 8.8% (National: 8.8%)
Manufacturing – 7.7% (National: 5.9%)
Labour force (all people 15+ who work OR are looking to work):
In labour force – 79.2% (National: 61.1%)
Employed – 95.8% (National: 94.9%)
Unemployed – 4.2% (National: 5.1%)
Not in labour force – 20.8% (National: 38.9%)
Employment type (of all people in labour force):
Full-time employed – 62% (National: 55.9%)
Part-time employed – 26.7% (National: 31.2%)
Away from work – 7.1% (National: 7.8%)
Unemployment rates per age group (of all people in each age group):
Ages 15-24 – 12.5% (National: 10.8%)
Ages 25-34 – 3.4% (National: 4.8%)
Ages 35-44 – 1.7% (National: 3.7%)
Ages 45-54 – 2.2% (National: 3.7%)
Ages 55-64 – 3.2% (National: 4.3%)
1-year residency movement:
Same address as 1 year ago – 80.5% (National: 84.1%)
Different address from 1 year ago – 19.5% (National: 15.9%)
5-year residency movement:
Same address as 5 years ago – 40.9% (National: 56.6%)
Different address from 5 years ago – 59.1% (National: 43.4%)
Travel to work:
Motor vehicle – 73.7% (National: 66.4%)
Working from home – 20% (National: 24.1%)
Public transport – 2.8% (National: 3.6%)
Walking – 0.6% (National: 2.9%)
Cycle – 0.2% (National: 0.8%)
Multiple modes of transport – 2.4% (National: 2.3%)
Religion:
Christianity – 49.6% (National: 47.3%)
No religion – 38.5% (National: 41.9%)
Hinduism – 5.3% (National: 2.9%)
Other – 3.5% (National: 1.4%)
Buddhism – 1.7% (National: 2.6%)
Islam – 1.3% (National: 3.5%)
Judaism – 0% (National: 0.4%)
Country of birth:
Born in Australia – 66.2% (National: 70.7%)
Born overseas – 33.8% (National: 29.3%)
Health issues (6 months or more): INTEREST all fairly low compared
Asthma – 7.6% (National: 8.1%)
Mental health condition – 7.1% (National: 8.8%)
Arthritis – 4.3% (National: 8.5%)
Diabetes – 2.7% (National: 4.7%)
Heart disease – 1.9% (National: 3.9%)
Cancer (including remission) – 1.6% (National: 2.9%)
Jump to top.
CAMIRA
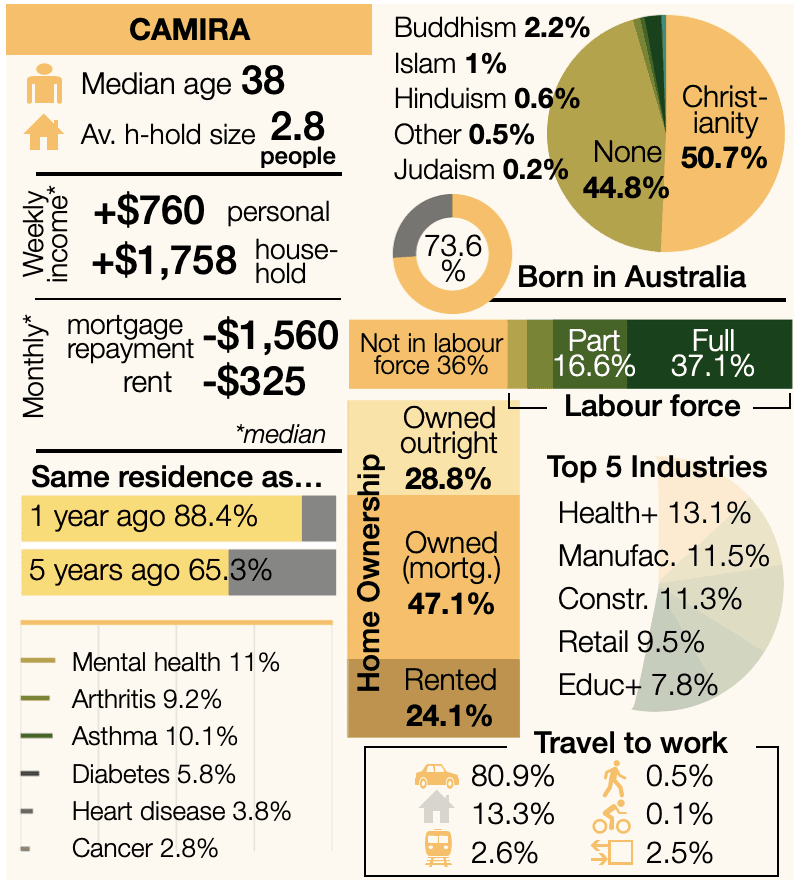
- Data for Camira has been grouped together with data for the suburb of Gailes.
Median age: 38 (National: 38)
Average household size: 2.8 people (National: 2.5 people)
Median weekly personal income: $760 (National: $805)
Median weekly household income: $1,758 (National: $1,746)
Home ownership:
Owned (outright) – 28.8% (National: 32.1%)
Owned (mortgage) – 47.1% (National: 36.2%)
Rented – 24.1% (National: 31.7%)
Median monthly mortgage repayment – $1,560 (National: $1,863)
Median weekly rent – $325 (National: $375)
Top 5 industries of residents:
Health Care and Social Assistance – 13.1% (National: 14.5%)
Manufacturing – 11.5% (National: 5.9%)
Construction – 11.3% (National: 8.9%)
Retail Trade – 9.5% (National: 9.1%)
Education and Training – 7.8% (National: 8.8%)
Labour force (all people 15+ who work OR are looking to work):
In labour force – 64% (National: 61.1%)
Employed – 93.1% (National: 94.9%)
Unemployed – 6.9% (National: 5.1%)
Not in labour force – 36% (National: 38.9%)
Employment type (of all people in labour force):
Full-time employed – 58% (National: 55.9%)
Part-time employed – 26% (National: 31.2%)
Away from work – 9.2% (National: 7.8%)
Unemployment rates per age group (of all people in each age group):
Ages 15-24 – 14.1% (National: 10.8%)
Ages 25-34 – 6.7% (National: 4.8%)
Ages 35-44 – 5% (National: 3.7%)
Ages 45-54 – 4.2% (National: 3.7%)
Ages 55-64 – 6.9% (National: 4.3%)
1-year residency movement:
Same address as 1 year ago – 88.4% (National: 84.1%)
Different address from 1 year ago – 11.6% (National: 15.9%)
5-year residency movement:
Same address as 5 years ago – 65.3% (National: 56.6%)
Different address from 5 years ago – 34.7% (National: 43.4%)
Travel to work:
Motor vehicle – 80.9% (National: 66.4%)
Working from home – 13.3% (National: 24.1%)
Public transport – 2.6% (National: 3.6%)
Walking – 0.5% (National: 2.9%)
Cycle – 0.1% (National: 0.8%)
Multiple modes of transport – 2.5% (National: 2.3%)
Religion:
Christianity – 50.7% (National: 47.3%)
No religion – 44.8% (National: 41.9%)
Buddhism – 2.2% (National: 2.6%)
Islam – 1% (National: 3.5%)
Hinduism – 0.6% (National: 2.9%)
Other – 0.5% (National: 1.4%)
Judaism – 0.2% (National: 0.4%)
Country of birth:
Born in Australia – 73.6% (National: 70.7%)
Born overseas – 26.4% (National: 29.3%)
Health issues (6 months or more):
Mental health condition – 11% (National: 8.8%)
Asthma – 10.1% (National: 8.1%)
Arthritis – 9.2% (National: 8.5%)
Diabetes – 5.8% (National: 4.7%)
Heart disease – 3.8% (National: 3.9%)
Cancer (including remission) – 2.8% (National: 2.9%)
Jump to top.
BELLBIRD PARK
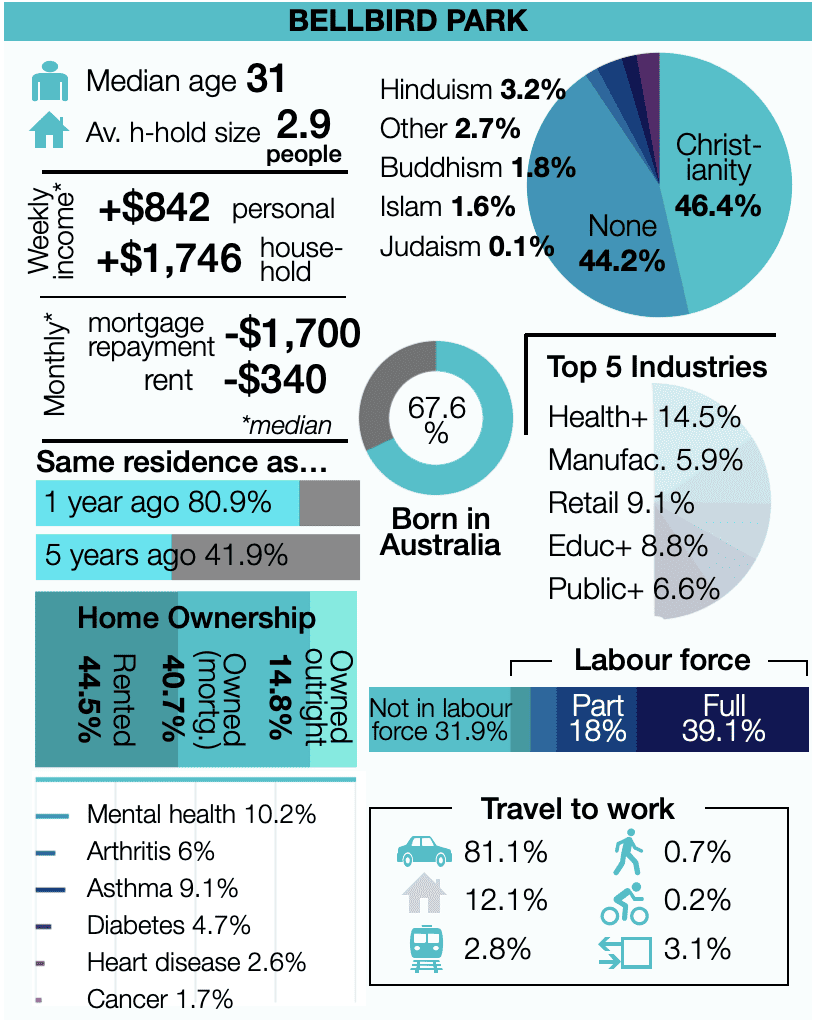
Median age: 31 (National: 38)
Average household size: 2.9 people (National: 2.5 people)
Median weekly personal income: $842 (National: $805)
Median weekly household income: $1,746 (National: $1,746)
Home ownership:
Owned (outright) – 14.8% (National: 32.1%)
Owned (mortgage) – 40.7% (National: 36.2%)
Rented – 44.5% (National: 31.7%)
Median monthly mortgage repayment – $1,700 (National: $1,863)
Median weekly rent – $340 (National: $375)
Top 5 industries of residents:
Health Care and Social Assistance – 15.8% (National: 14.5%)
Manufacturing – 9.9% (National: 5.9%)
Retail Trade – 9.5% (National: 9.1%)
Education and Training – 7.8% (National: 8.8%)
Public Administration and Safety – 7.2% (National: 6.6%)
Labour force (all people 15+ who work OR are looking to work):
In labour force – 68.1% (National: 61.1%)
Employed – 93.3% (National: 94.9%)
Unemployed – 6.6% (National: 5.1%)
Not in labour force – 31.9% (National: 38.9%)
Employment type (of all people in labour force):
Full-time employed – 58.4% (National: 55.9%)
Part-time employed – 26.5% (National: 31.2%)
Away from work – 8.6% (National: 7.8%)
Unemployment rates per age group (of all people in each age group):
Ages 15-24 – 15.4% (National: 10.8%)
Ages 25-34 – 4.7% (National: 4.8%)
Ages 35-44 – 4.2% (National: 3.7%)
Ages 45-54 – 3.8% (National: 3.7%)
Ages 55-64 – 8.3% (National: 4.3%)
1-year residency movement:
Same address as 1 year ago – 80.9% (National: 84.1%)
Different address from 1 year ago – 19.1% (National: 15.9%)
5-year residency movement:
Same address as 5 years ago – 41.9% (National: 56.6%)
Different address from 5 years ago – 58.1% (National: 43.4%)
Travel to work:
Motor vehicle – 81.1% (National: 66.4%)
Working from home – 12.1% (National: 24.1%)
Public transport – 2.8% (National: 3.6%)
Walking – 0.7% (National: 2.9%)
Cycle – 0.2% (National: 0.8%)
Multiple modes of transport – 3.1% (National: 2.3%)
Religion:
Christianity – 46.4% (National: 47.3%)
No religion – 44.2% (National: 41.9%)
Hinduism – 3.2% (National: 2.9%)
Other – 2.7% (National: 1.4%)
Buddhism – 1.8% (National: 2.6%)
Islam – 1.6% (National: 3.5%)
Judaism – 0.1% (National: 0.4%)
Country of birth:
Born in Australia – 67.6% (National: 70.7%)
Born overseas – 32.4% (National: 29.3%)
Health issues (6 months or more):
Mental health condition – 10.2% (National: 8.8%)
Asthma – 9.1% (National: 8.1%)
Arthritis – 6% (National: 8.5%)
Diabetes – 4.7% (National: 4.7%)
Heart disease – 2.6% (National: 3.9%)
Cancer (including remission) – 1.7% (National: 2.9%)
Jump to top.